Abstract
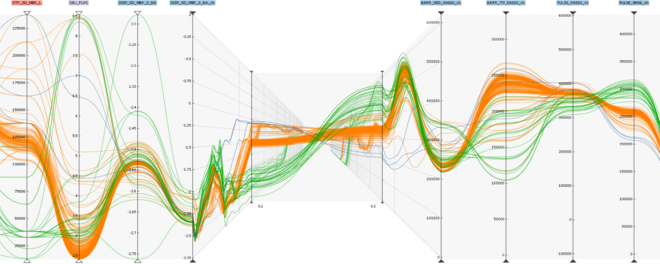
We present a natural extension of two-dimensional parallel-coordinates plots for revealing relationships in time-dependent multi-attribute data by building on the idea that time can be considered as the third dimension. A time slice through the visualization represents a certain point in time and can be viewed as a regular parallel-coordinates display. A vertical slice through one of the axes of the parallel-coordinates display would show a time-series plot. For a focus-and-context integration of both views, we embed time-series plots between two adjacent axes of the parallel-coordinates plot. Both time-series plots are drawn using a pseudo three-dimensional perspective with a single vanishing point. An independent parallel-coordinates panel that connects the two perspectively displayed time-series plots can move forward and backward in time to reveal changes in the relationship between the time-dependent attributes. The visualization of time-series plots in the context of the parallel-coordinates plot facilitates the exploration of time-related aspects of the data without the need to switch to a separate display. We provide a consistent set of tools for selecting and contrasting subsets of the data, which are important for various application domains.