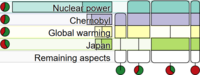
Burger Charts: A Quantitative Display of Set Intersections
A new technique to visualize datasets with many binary attributes, that encode the existence of a property, like keyword occurrences.
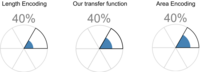
Rose Charts: Area or Length Encoding for Fill Level of Circle Sectors?
A perception study that reveals the perception mechanism for judging values from fill levels in circle sectors.
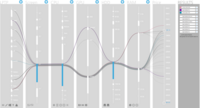
Smooth Transitions Between Parallel Coordinates and Scatter Plots via Polycurve Star Plots
A new technique for seamlessly transitioning between parallel coordinate plots and scatter plots, a description of polycurve star plots and a geometrically motivated method to embed scatter points from a scatter plot into star plots and parallel coordinate plots.

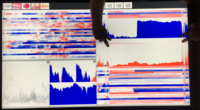
Multitouch Interaction with Parallel Coordinates on Large Vertical Displays
A multitouch vocabulary for interacting with parallel coordinates plots on wall-sized displays beyond arms' reach.

Short-Contact Touch-Manipulation of Scatterplot Matrices on Wall Display
A short-contact multitouch vocabulary for interacting with scatterplot matrices (SPLOMs) on wall-sized displays.
Configuration Finder: A Tidy Visual Interface for Effective Faceted Search
An interactive visualization aiding users in making informed decisions about large product data sets consisting of quantitative and categorical attributes.
Touch the Time
Direct-touch centered paradigms for exploring time series data visualized in a coordinated multi-view display.

Visual Monitoring of Photovoltaic Systems
A scalable visual analytics framework for managing and analyzing multi-variate time-series data of hundreds of geographically distributed photovoltaic systems.
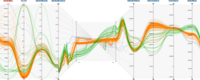
Time-Series Plots Integrated in Parallel-Coordinates Displays
A natural and seamless extension of two-dimensional parallel-coordinates plots for revealing relationships in time-dependent multi-attribute data by building on the idea that time can be considered as the third dimension.
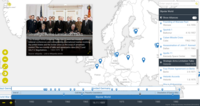
HistoGlobe: Teaching History Visually
HistoGlobe is an interactive historical geographic information system (HGIS) that provides students with gathered and curated historical information for self-study and aids teachers during history classes.
The Product Explorer: Decision Making with Ease
An interactive parallel coordinates display for facilitating the selection process of products with many attributes. Users can quickly narrow down the product search to a small subset or even a single product by using our visual query interface.

Visualizing Food Ingredients for Kids by Utilizing Glyph-Based Characters
A system for visualizing food ingredients with a glyph-based approach aimed at children between the ages of four and eight, approximately.
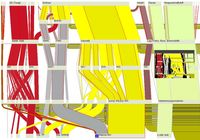
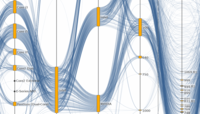
Interactive Sankey Diagrams
A system that allows users to interactively explore complex flow scenarios represented as Sankey diagrams.
The i-Disc
A tool to interactively visualize and explore medium sized topic maps.