Introduction
This project integrates information on data errors and uncertainties into the geoscientific visualization process. This information - widely ignored in todays visualization systems - could increase the confidence into the decisions of geoscientists.
There are many ways to include data uncertainty information into the visualization process. There are two general directions: The information can be used directly during the rendering process of the data which basically means that the appearance of the data is altered in some way according to its errors or uncertainties. Alternatively the information can be used to add particular overlays to the actual visualization to communicate it to the viewer. Methods for directly using the uncertainty information in the rendering process include techniques like modifying data attributes like color, opacity, texture or attributes which change the appearance of the data completely. For example surfaces whose progression is very unreliable can be rendered using point or line primitives which are spatially distorted according to the local reliability. This takes away the smooth and exact look in unreliable regions of such surfaces and gives very good hints about the location and size of the unreliability. There are many other methods like adding a diffuse volume around a surface, altering the surface parameters like normals to change its appearance under normal lighting conditions or techniques to blur unreliable regions of the data. Methods which add special overlays to the data include techniques like adding geometric icons (glyphs) to the visualization. Theses glyphs may display uncertainty information in different ways. For example, line or point glyphs can represent the location and magnitude of uncertainties on a surfaces or within a volume.
Project
In close collaboration with the VRGeo consortium we focus on the analysis and development of methods integrate information about errors or uncertainties in the visualization process of geological data. These methods mainly augment the work in the field of oil and gas exploration but they are also applicable to other application areas like medical visualization. Most techniques can be classified in one or more of the following three categories:
- highlighting uncertain regions of the data
- obscuring or hiding uncertain regions
- showing the magnitude and extent of the uncertainties
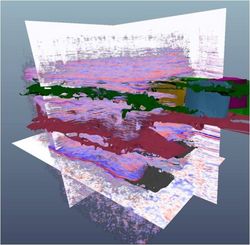
Our initial research focused on the development of methods for directly visualizing uncertainties in the seismic volume by manipulating the color mapping according to the amount of uncertainty. We employed techniques like transparency, desaturation and inversion of the used color mapping (c.f. Figure 1).
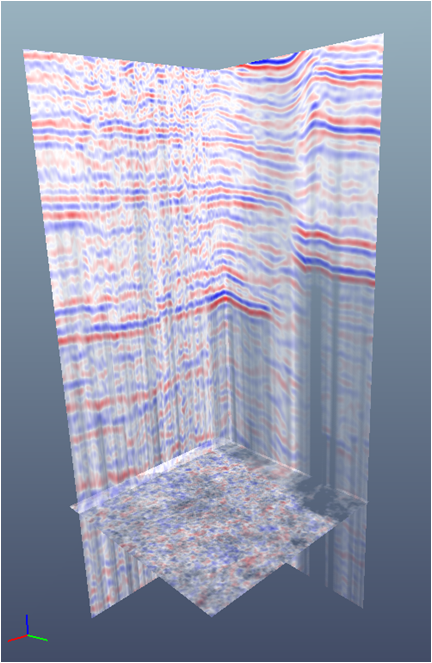
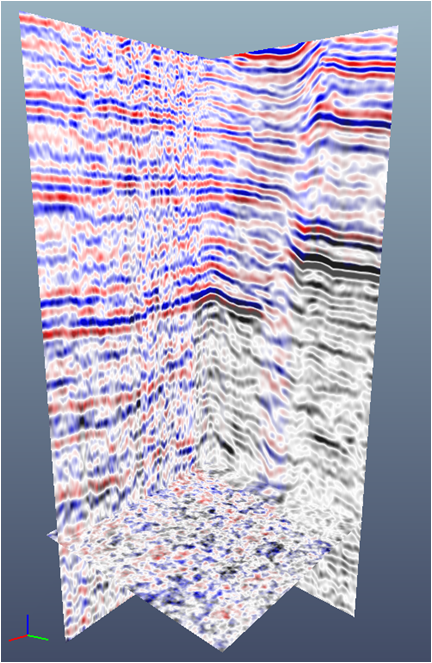
In later experiments we developed methods to present different types of uncertainty, for example positional uncertainty of the volume sample positions. Our rendering approach for such kinds of uncertainties enables us to achieve effects like volume distortion or blurring in the affected regions (c.f. Figure 2, click for animations).

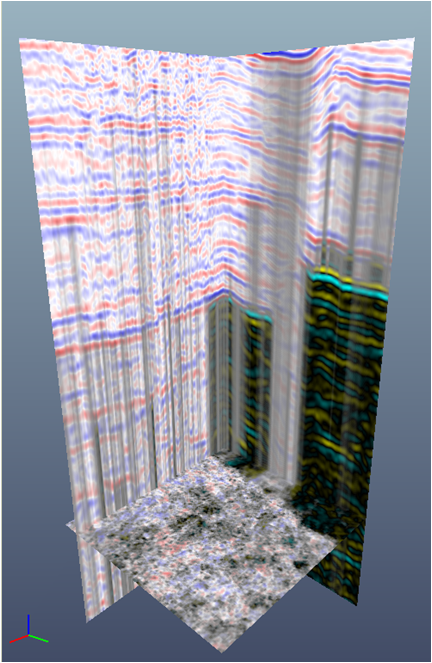
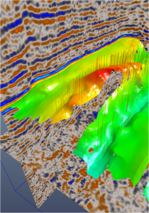
Our current activities focus on the development of new uncertainty methods for surface data interpreted of the seismic volume such as faults and horizons. Our techniques are trying to convey the uncertainties through direct rendering the information like local surface deformation or through alteration of their appearance. We also employ indirect rendering techniques like superimposing glyphs or volume on the actual data visualization. Using Glyphs the uncertainty information is encoded through the alteration of attributes of discretely placed geometries, for example the length or color of lines. The volume surface approach tries to emphasize the reliability of surface regions through the thickness of the surface. (c.f. Figure 3, click for animations)


Collaboration
- VRGeo Consortium
- Fraunhofer IAIS, St. Augustin