

Visual Text Analytics

Digital Read-Pair-Share
A Didactic Application for Collaborative Reading and Visual Reading Analytics
[more details]
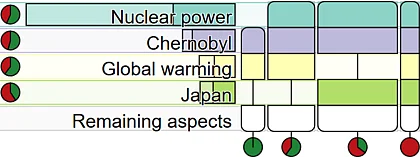
Burger Charts: A Quantitative Display of Set Intersections
A new technique to visualize datasets with many binary attributes, that encode the existence of a property, like keyword occurrences.
[more details]
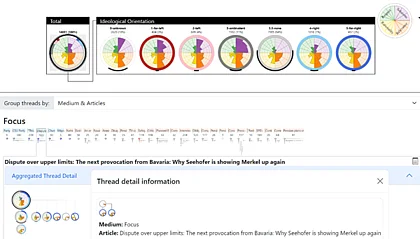
Comment Analyzer: A Tool for Analyzing Comment Sets and Thread Structures of News Articles
A visual analytics system for exploring, analyzing and comparing deliberative indicators in thread structures and comment sets in comment-thread corpora.
[more details]
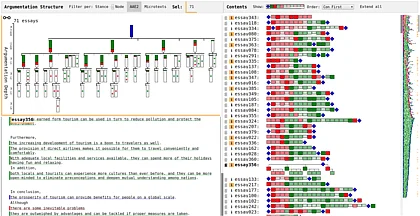
Visual Analysis of Argumentation in Essays
A visual analytics system for exploring, analyzing and comparing argument structures in essay corpora.
[more details]
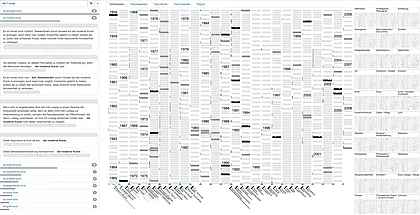
Visualizing a Thinker's Life
A visualization framework that aids readers in understanding and analyzing the contents of medium-sized text collections that are typical for the opus of a single or few authors.
[more details]
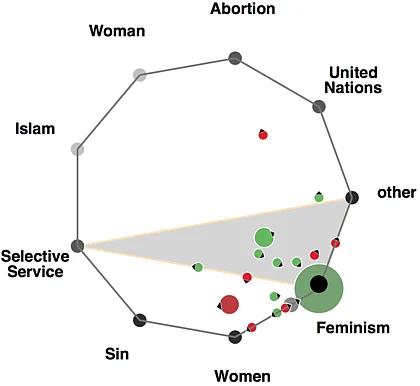
Topic Space Visualization
A visualization to learn about the diverse topical aspects of an argument search engine.

Visualizing Article Similarities in Wikipedia
A visualization providing insight about similarities among Wikipedia articles in terms of structure as well as content.
[more details]
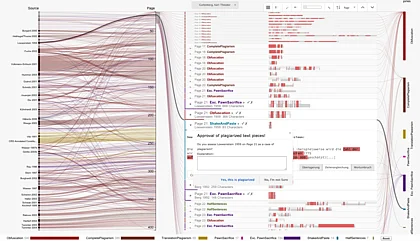
Visual Assessment of Alleged Plagiarism Cases
A visual analysis tool to support the verification, assessment, and presentation of alleged cases of plagiarism.
[more details]
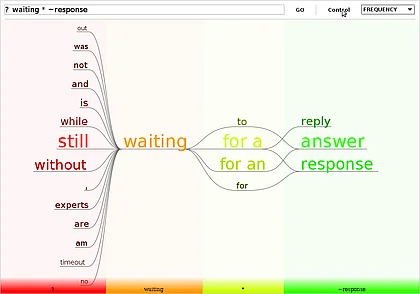
The Netspeak Wordgraph
The Wordgraph helps writers in visually choosing phrases while writing a text. The graphical interface provides an effective means for interactive exploration of search results using filter techniques, query expansion and navigation.
[more details]