Abstract
We present a system that allows users to interactively explore complex flow scenarios represented as Sankey diagrams. Our system provides an overview of the flow graph and allows users to zoom in and explore details on demand. The support for quantitative flow tracing across the flow graph as well as representations at different levels of detail facilitate the understanding of complex flow situations.
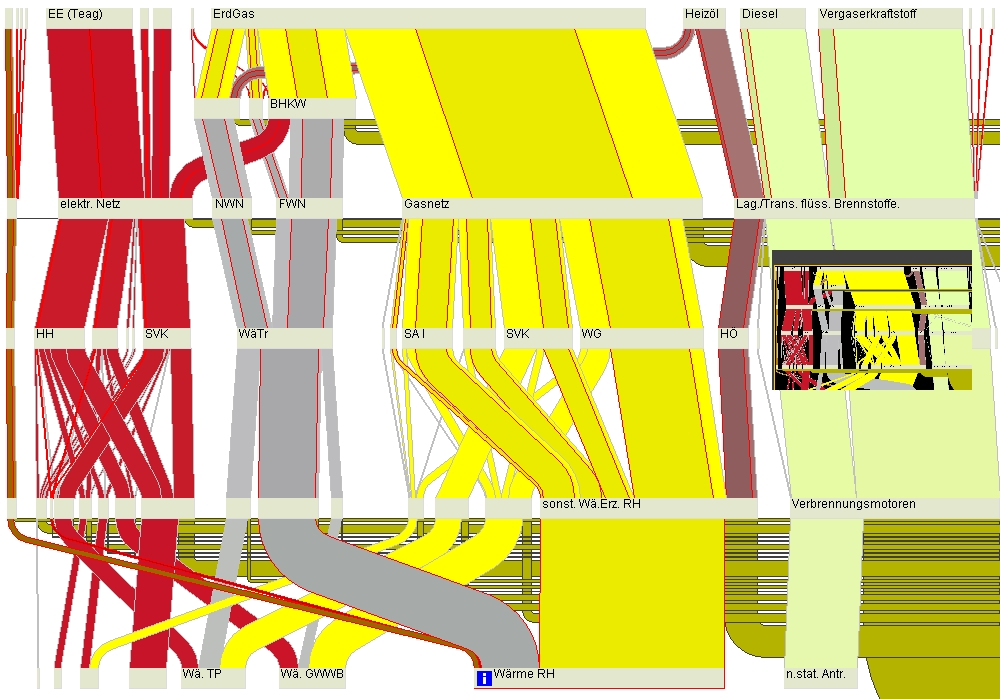
The energy flow in a city serves as a sample scenario for our system. Different forms of energy are distributed within the city and they are transformed into heat, electricity, or other forms of energy. These processes are visualized and interactively explored. In addition our system can be used as a planning tool for the exploration of future scenarios by interactively manipulating different parameters in the energy flow network.
Publications and Further Information
- Patrick Riehmann, Manfred Hanfler, and Bernd Froehlich:
Interactive Sankey Diagrams
In Proceedings of the IEEE Symposium on Information Visualization (InfoVis 05), pp. 233-240, October 2005 - Presentation at InfoVis2005
- Detailed Description
- Interactive Sankey Browser (in German)
- video (.mov)