
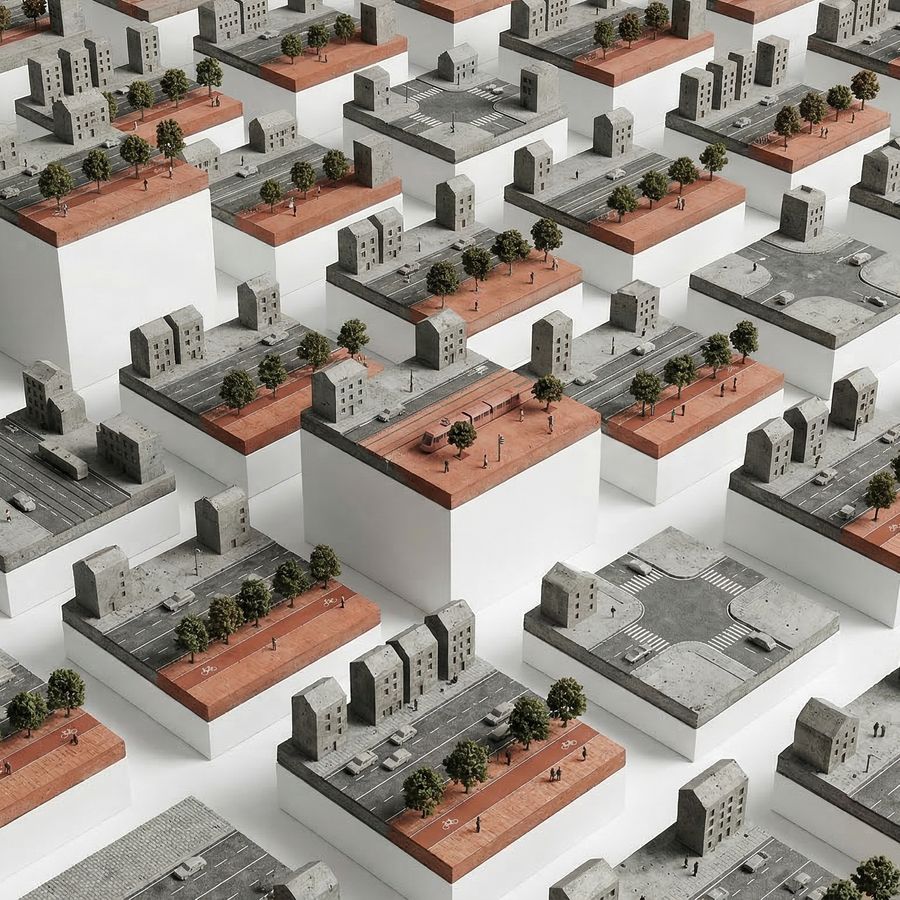
Thesis Topic - Every Street
A generative AI-powered diagnostic that measures the gap between what every street is and what it could be.
Dr.-Ing. Martin Bielik · Chair of Informatics in Architecture and Urbanism · Bauhaus-Universität Weimar
Imagine a map that shows not what a city's streets look like, but how much better each one could be.
Summary
The most impactful street to redesign in a city is probably not the one being redesigned. No one can evaluate thousands of streets to find out which ones have the most to gain, so resources go where attention happens to land — a citizen complaint, a political promise — while the biggest opportunities stay hidden.
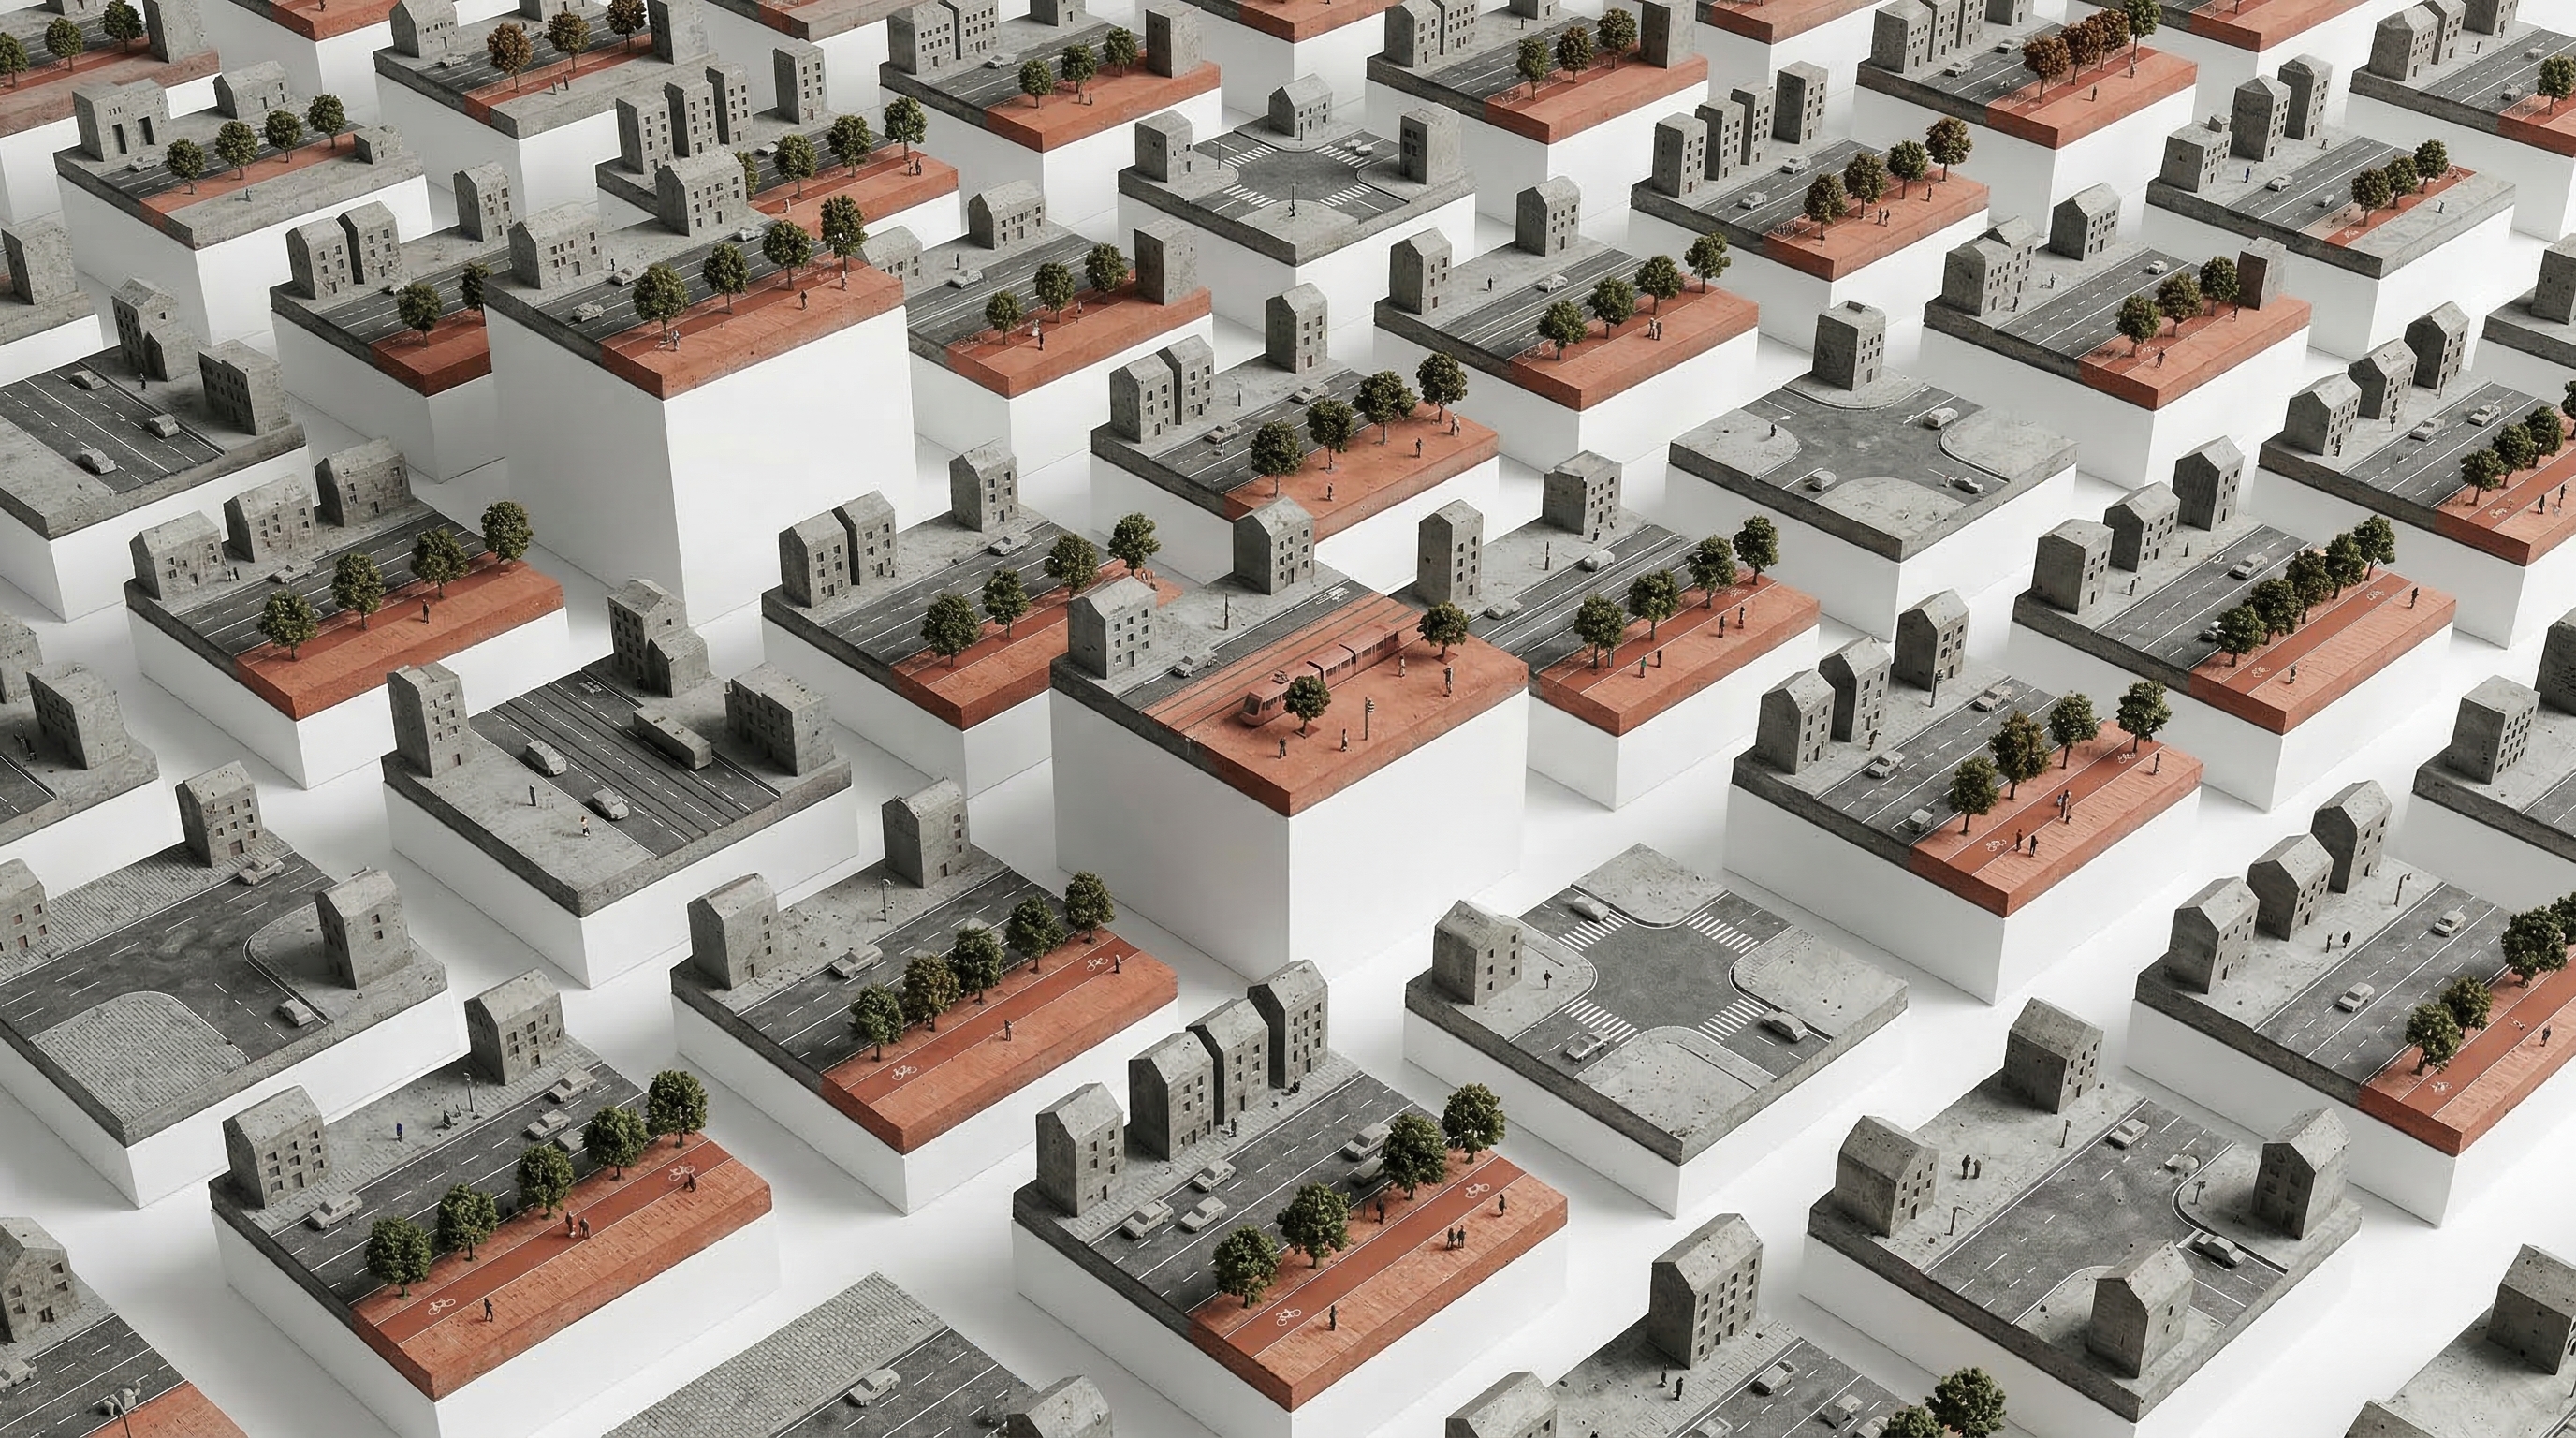
This thesis builds a city-scale diagnostic tool that generates AI-powered redesign proposals for every street — not as final designs, but as disposable probes. By comparing what each street is to what it could be, the tool produces a map of untapped potential across an entire district or city. Planners can then see, for the first time, where the gap between current conditions and achievable quality is largest and direct resources where they matter most.
Description
1. Problem Statement
The most impactful street to redesign in a city is probably not the one being redesigned. Not because planners choose poorly — but because no one can evaluate thousands of streets to find out which ones have the most to gain. So redesign goes where attention lands: a citizen complaint, a broken pipe, a political promise. The biggest opportunities stay hidden because nobody has the capacity to look. There is no systematic way to ask: across all the streets in this city, where is the gap between what exists and what could exist the largest? Which redesigns would unlock the most value — in walkability, greenery, safety, public life — per euro spent?
As AI-driven design generation matures, it becomes possible to produce a plausible redesign proposal for any street segment — given enough information about what exists and what good design looks like. This thesis takes that capability to its logical conclusion: generate proposals not for one street, but for all of them. The generated designs are not the product — they are disposable probes. What matters is the gap they reveal between what each street is and what it could be. The result is a diagnostic layer over the entire city that makes hidden opportunities visible and comparable. The urban designer's role shifts from producing individual proposals to curating a city-wide strategy: identifying priorities, spotting patterns, and directing resources where they matter most.
2. Expected Outcome
A working city-scale diagnostic tool that reveals where a city's streets fall furthest behind their potential — and where intervention would unlock the most value. The tool uses AI-generated redesign proposals as a measuring instrument: not as final designs to be built, but as probes that make the gap between current conditions and achievable quality visible and comparable across hundreds of streets.
The student must define and deliver three things:
1. The generation strategy. The generated proposals do not need to be buildable — they need to be good enough that the gap they reveal is meaningful. This is still a design challenge: garbage in, garbage out. The student must define:
- What does the AI need to know about a street to produce a proposal that credibly represents its potential? Geometry, traffic, land use, surrounding context — what matters and what can be left out?
- What design knowledge, examples, or guidelines improve the output? Are there reference streets, design manuals, or precedent libraries that help?
- How are constraints communicated — what must stay fixed (building lines, utilities) and what is free to change?
2. The impact evaluation. How do you measure the gap between what a street is and what it could be? The student must define:
- What criteria capture the quality of a street? Walkability, green cover, cycling infrastructure, public space, safety — which dimensions matter and how are they measured?
- How is the comparison made? Pixel-level analysis of before/after images, spatial metrics extracted from proposals, expert scoring, or a combination?
- How are results made comparable across hundreds of streets so that the biggest opportunities surface?
3. The diagnostic platform. A working pipeline and dashboard applied to a real urban context (a district or small city — hundreds of street segments):
- An automated pipeline from street network to generation input to output collection
- A diagnostic dashboard that visualizes where the biggest untapped potential lies, filterable by dimension
- An expert review with 2–3 planners or urban designers evaluating whether the diagnostic produces actionable priorities
3. Presentation & Portfolio Value
Final presentation: Interactive walkthrough of the diagnostic dashboard applied to a real city context — zooming from city-wide patterns to specific streets, demonstrating how the tool identifies priority interventions. Accompanied by expert feedback.
Career signal: This thesis demonstrates the ability to: think at urban-systems scale; build data-driven decision-support tools for planning practice; work with AI generation at scale; and translate complex spatial data into actionable priorities — relevant for urban analytics firms, municipal innovation units, smart city initiatives, and planning consultancies.
4. Submission
Always required:
- Portfolio PDF (2 pages, A4) — visual summary: the diagnostic concept, a city-wide map showing where untapped potential is highest, before/after comparisons for selected streets, and key findings from the expert review.
- 30-second video reel — a shareable teaser showing the dashboard in action: zooming from city-scale patterns to individual streets, revealing where the biggest opportunities lie.
- 5-minute explainer video — walks through the problem, the generation strategy, the impact evaluation method, the dashboard, and expert feedback.
Working prototype:
The diagnostic pipeline and dashboard, runnable by the reviewer. A reviewer should be able to explore the city-wide map, filter by quality dimension, zoom into specific streets, and see the gap between existing conditions and generated potential.
Specification document:
Describes the system's design logic: the generation strategy (what inputs describe a street, what design knowledge guides the AI, how constraints are communicated), the impact evaluation method (what criteria define street quality, how the before/after gap is measured, how results are made comparable across streets), and the dashboard's information architecture (what is shown, how it is filtered, how priorities surface). Not code documentation — the design decisions and their rationale.
Validation report:
Documents the expert review: who reviewed (2–3 planners or urban designers), what they were shown, and their assessment. Reports whether the diagnostic surfaces priorities the experts agree with, whether it reveals opportunities they had not identified, and where the tool's judgement diverges from professional intuition. Method, data, and findings.
5. Requirements
Baseline: Experience with AI-assisted coding workflows; prior web development experience (the thesis produces a web-based diagnostic dashboard � previous projects can be AI-generated); understanding of street design and urban spatial quality; familiarity with spatial data (GIS, OpenStreetMap, or similar).
Acquirable during the thesis: Working with AI design generation tools at scale; automated spatial data pipelines; expert evaluation methods.
6. Solution Space (deliberately open)
The thesis is deliberately open in how generation, evaluation, and visualization are approached. The generation engine could use image-based AI models (generating street visualizations), plan-based models (generating cross-sections or layouts), or a hybrid. Impact evaluation could rely on automated image analysis, spatial metrics extracted from generated plans, expert scoring, or learned quality predictors. The dashboard could be a web-based map, a GIS plugin, or a standalone application. The student is encouraged to explore what works best for their chosen urban context — and to propose approaches not listed here.
7. Project Stages
- Generation strategy — What does the AI need to know about a street to redesign it well? Define the inputs, constraints, and design knowledge (examples, guidelines, precedents) that guide the generation. Test on a small sample and iterate.
- Impact evaluation — Define what makes a street good and how to measure the gap between existing and proposed. Select criteria, develop the comparison method, and validate it on sample streets.
- Data pipeline & city-scale run — Build the automated pipeline from street network to generation to evaluation. Apply it to a real urban context (a district or small city — hundreds of segments).
- Diagnostic dashboard — Build the visualization layer: map of current vs. potential, filterable by dimension, zoomable from city-wide to street-level.
- Expert review — Present the diagnostic to 2–3 planners or urban designers. Does it surface priorities they agree with? Does it reveal anything they didn't see?
- Documentation & presentation — Write the thesis. Prepare the interactive dashboard walkthrough for the final review.
8. Keywords
urban design automation, city-scale analysis, street redesign, design potential, spatial diagnostics, decision support, urban analytics, generative design, priority mapping
Before You Apply
Read the supervision terms and conditions — how I work, the timeline and deadlines, the consultation structure, and what is due when.
Dr.-Ing. Martin Bielik · InfAU · Bauhaus-Universität Weimar