Designing out of the Box | Electricity Usage Visualization
Project information
submitted by
Nhi Dam
Mentors
Prof. Eva Hornecker, Michaela Honauer
Faculty:
Media
Degree programme:
Human-Computer Interaction (Master of Science (M.Sc.))
Type of project presentation
Research project
Semester
Summer semester 2021
Project description
PROBLEM
Global development goes hand in hand with the continuous growth of energy consumption, leading to many environmental issues. However, people hardly understand their consumption as it's not visible, also there's a lack of accessible mechanisms for people to keep track of their usage.
OBJECTIVE
The system aims to investigate people's needs and perceptions in terms of visualization to trigger sustainable behavior in their living environment.
DETAIL
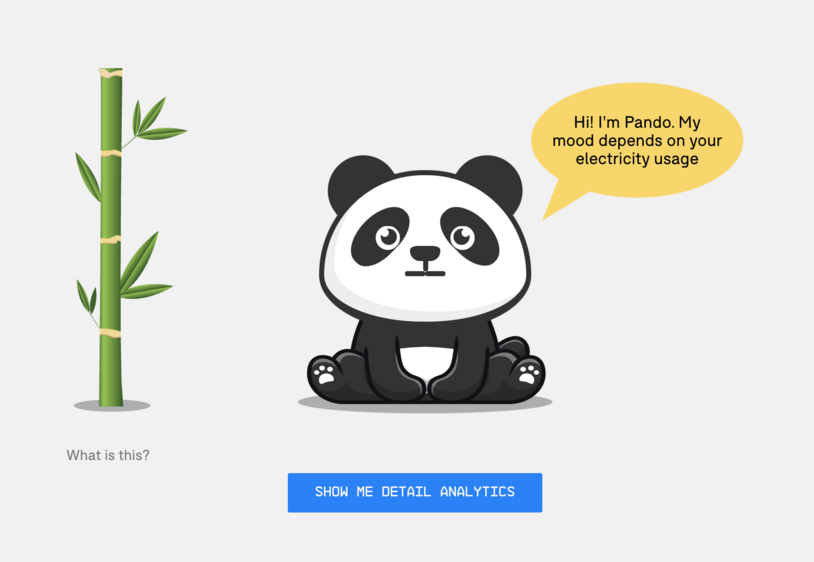
I built a web application to visualize users' electricity usage through two separate types of artifacts:
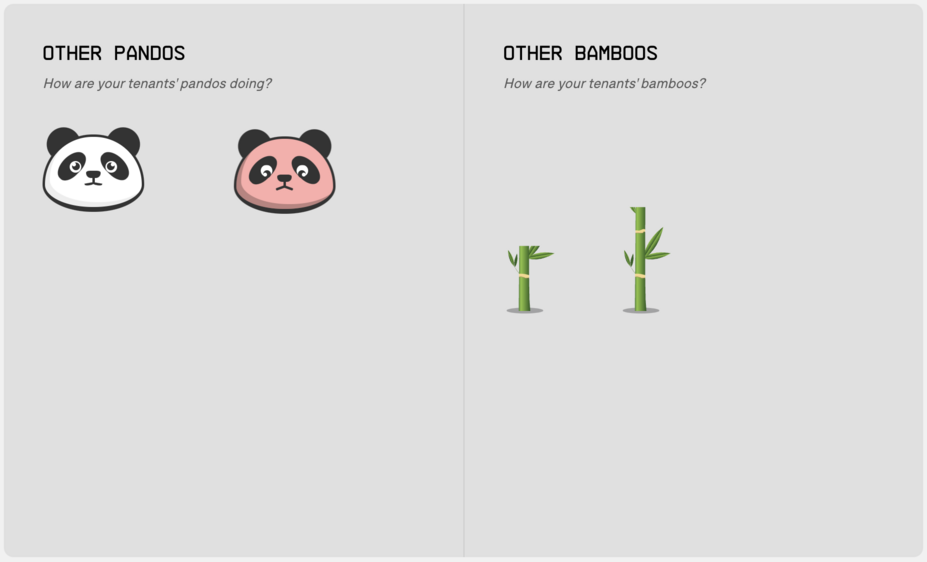
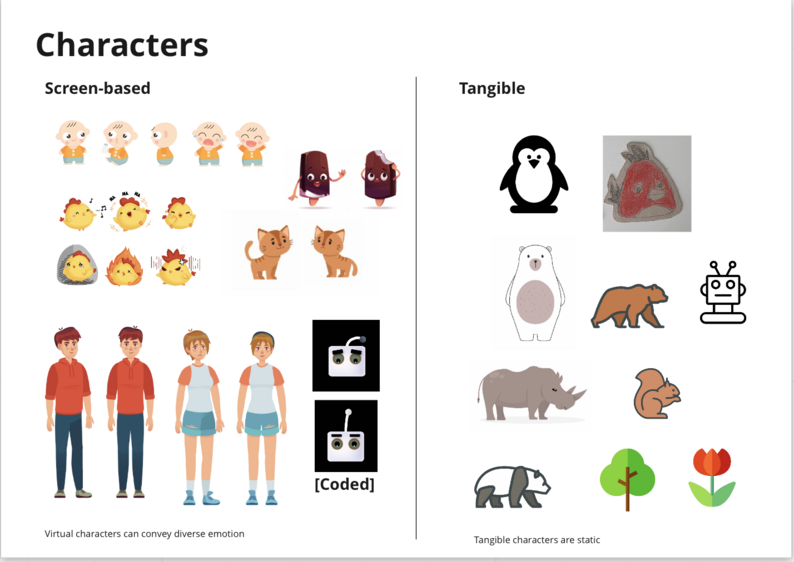
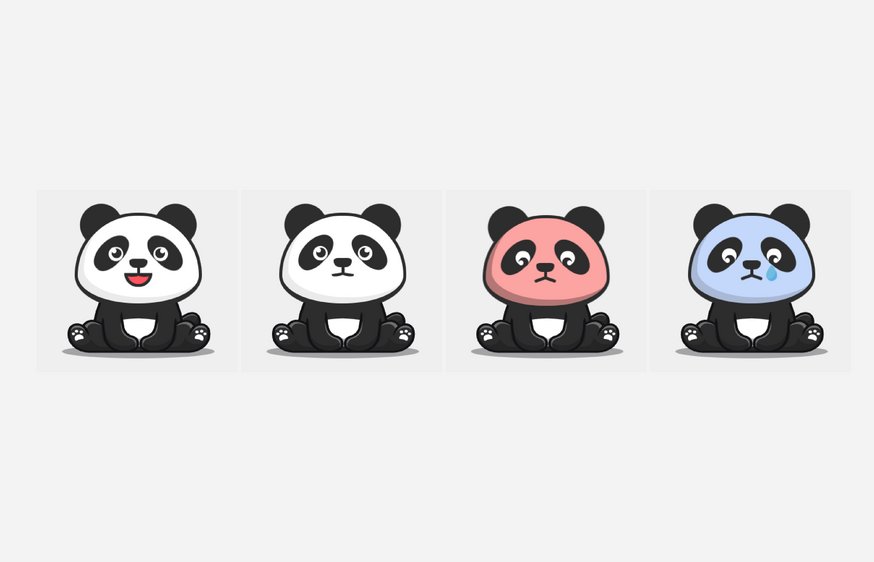
1. Characters: use of panda and bamboo to represent consumption. Panda expresses its emotion based on usage amount in real-time, including four emotion states: happy - neutral - sad - cry. While Panda's emotion gives instant feedback for its owner usage, it is unable to give the overall information for a long time (e.g. a day). Bamboo is used to complement this aspect, it grows throughout the day based on the Panda's emotion (it shortens when the panda is sad, lengthens when the panda is happy)
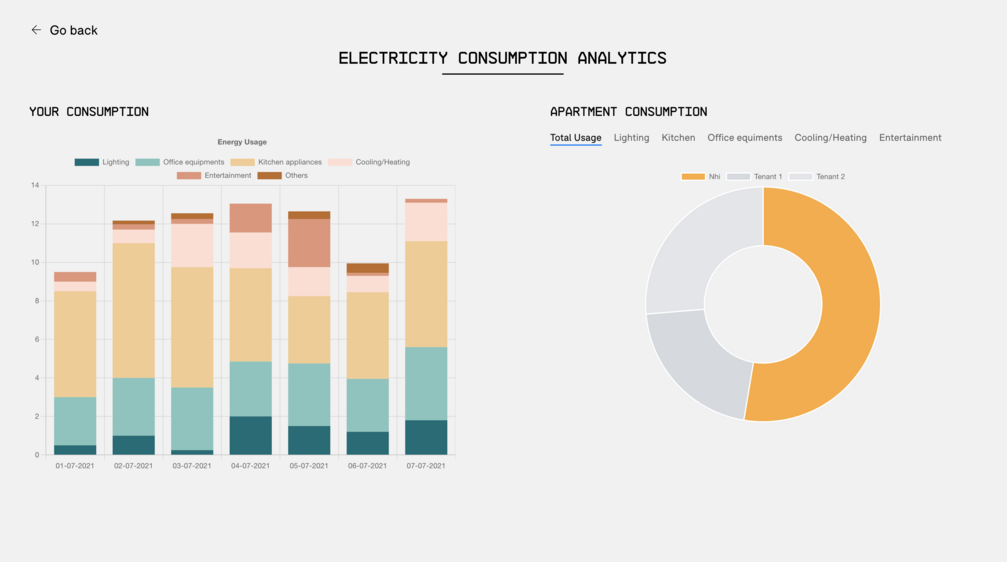
2. Analytics: represent usage by detailed charts, showing detailed information on each category of usage by day
Group users are able to compare their consumption with other people in the houses through both characters and analytics.
Project is available at: energy.begin.vn
Videos

https://vimeo.com/574846780
Click the Play button to load and view external content from Vimeo.com.
Automatically load and view external content from Vimeo.com (You can change this setting at any time via our »Data protection policy«.)
Exhibition Location / Event Location
- – ONLINE –
- – ONLINE –
- – ONLINE –
- – ONLINE –

