mNo edit summary |
|||
| (9 intermediate revisions by 2 users not shown) | |||
| Line 1: | Line 1: | ||
==EHP - Emotion Heartbeat Project== | ==EHP - Emotion Heartbeat Project== | ||
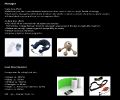
The "Emotion Heartbeat Project" is a project that will collect my heartrate as a datatype. This data will be displayed in a visual way with diagrams and create an emotional diary out of that. With an increased heartrate the heartrate monitor will ask for the cause of it to differentiate between positive and negative stress or sports activities. | The "Emotion Heartbeat Project" is a project that will collect my heartrate as a datatype. This data will be displayed in a visual way with diagrams and create an emotional diary out of that. With an increased heartrate the heartrate monitor will ask for the cause of it to differentiate between positive and negative stress or sports activities. | ||
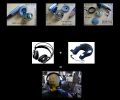
===First Ideas And Thoughts=== | ===First Ideas And Thoughts=== | ||
<gallery> | <gallery> | ||
File: | File:0 1 frontpage 1.jpg|EHP | ||
File: | File:0 2 frontpage 2.jpg|Emotion Diary | ||
File: | File:1 page1.jpg|Headphones | ||
File: | File:2 page2.jpg|Heartrate Monitor | ||
File: | File:3 decision diagram.jpg|Decision Diagram | ||
File: | File:IMG 0863.JPG|Manual Measurement | ||
File: | File:4 page4.jpg|Collected Heartbeat-Data Within 1 Week | ||
File: | File:5 page5.jpg|Heartrate Diagrams | ||
</gallery> | </gallery> | ||
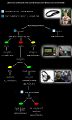
One of my first ideas was to connect the heartrate monitor with headphones that would calm down my increased heartrate with music and vibrating sensors at my neck; showing picture 3 and 5. The decision diagram displays how this should work. | One of my first ideas was to connect the heartrate monitor with headphones that would calm down my increased heartrate with music and vibrating sensors at my neck; showing picture 3 and 5. The decision diagram displays how this should work. | ||
But within this semester I will just build up the heartrate monitor itself. | But within this semester I will just build up the heartrate monitor itself. | ||
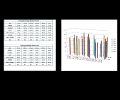
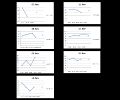
Picture 6 and 7 are showing the result of 1 week of collecting heartrate data. I counted my heartbeat within 1 minute manually 4 times a day for 1 week. Pic 6 shows a diagram displaying the whole week at a glance; Pic 7 shows the diagrams of each day in particular. (Unfortunately I couldn't get it work with a consistent scale for the heartrate.) | Picture 6 and 7 are showing the result of 1 week of collecting heartrate data. I counted my heartbeat within 1 minute manually 4 times a day for 1 week. Pic 6 shows a diagram displaying the whole week at a glance; Pic 7 shows the diagrams of each day in particular. (Unfortunately I couldn't get it work with a consistent scale for the heartrate.) | ||
====Related Links To That Topic==== | |||
*http://www.eng.utah.edu/~jnguyen/ecg/instructions.html | *http://www.eng.utah.edu/~jnguyen/ecg/instructions.html | ||
*http://www.swharden.com/blog/2009-08-14-diy-ecg-machine-on-the-cheap/ | *http://www.swharden.com/blog/2009-08-14-diy-ecg-machine-on-the-cheap/ | ||
*http://infosthetics.com/archives/2006/07/beating_heart_blog.html | *http://infosthetics.com/archives/2006/07/beating_heart_blog.html | ||
*http://netzspannung.org/cat/servlet/CatServlet/$files/320590/herzfassen-technik.pdf | *http://netzspannung.org/cat/servlet/CatServlet/$files/320590/herzfassen-technik.pdf | ||
===How To Build It?=== | ===How To Build It?=== | ||
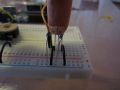
HEARTRATE SENSOR, SIMPLE CIRCUIT | |||
<gallery> | <gallery> | ||
File: | File:IMG 0804.JPG|circuit 1 | ||
File: | File:IMG 0805.JPG|circuit 2 | ||
File: | File:IMG 0807.JPG|circuit 3 | ||
File: | File:IMG 0812.JPG|circuit 4 | ||
File:IRDetector-0.jpg|IR-Emitter/Detector | File:IRDetector-0.jpg|IR-Emitter/Detector | ||
File:basicirdetectemit.gif| | File:basicirdetectemit.gif|circuit schematic | ||
File:arduino-processing.jpg| | File:arduino-processing.jpg|arduino processing | ||
File: | File:processing heartrate.jpg|processing screen | ||
</gallery> | </gallery> | ||
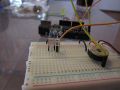
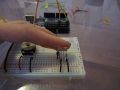
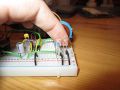
Inspired by diverse links and Youtube videos the very first try to build it was to use IR Emitter and Detector. It didn't work that well: the sensors are pretty sensitive for moving action and the signal at processing was very faint. | |||
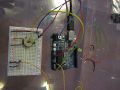
So I decided to try it again with an amplifier to get a stronger signal of my heartbeat. | |||
<br> | <br> | ||
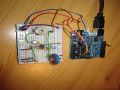
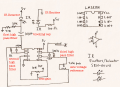
To amplify the signal I used a low voltage op-amp LM358N. | To amplify the signal I used a low voltage op-amp LM358N. | ||
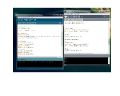
The images of the third gallery show the circuit, schematic and processing screen result. | The images of the third gallery show the circuit, schematic and processing screen result. | ||
<br> | <br> | ||
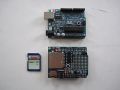
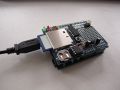
The Data Logger Shield for the Arduino board is directly plugged on the top of it and will save the collected data to a SD card. | |||
HEARTRATE SENSOR WITH AMPLIFIER | |||
<gallery> | |||
File:IMG 0821.JPG|circuit with amplifier | |||
File:IMG 0822.JPG|circuit with amplifier | |||
File:amplifier.png|circuit schematic | |||
File:processing heartrate 4.jpg|processing screenshot | |||
File:IMG 0827.JPG|Arduino with Data Logger Shield | |||
File:IMG 0826.JPG|Arduino with Data Logger Shield | |||
</gallery> | |||
[[Codes for Arduino and Processing]] | |||
====Related Links==== | |||
*http://www.youtube.com/watch?v=BAp1snPchT4&NR=1 | *http://www.youtube.com/watch?v=BAp1snPchT4&NR=1 | ||
*http://www.youtube.com/watch?v=yADsi5W-Lls | *http://www.youtube.com/watch?v=yADsi5W-Lls | ||
*http://www.andere-baustelle.net/? | *http://www.andere-baustelle.net/?page id=101 | ||
*http://suchamagicworld.blogspot.com/2008/04/still-alive-heartbeat-irsensor-report.html | *http://suchamagicworld.blogspot.com/2008/04/still-alive-heartbeat-irsensor-report.html | ||
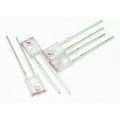
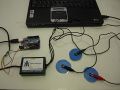
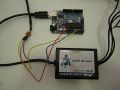
THE EKG SENSOR | |||
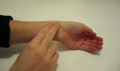
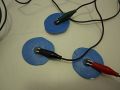
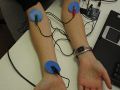
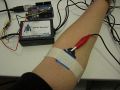
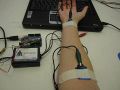
The selfmade sensor with the IR Emitter and Detector is very sensitive for any motion and movements of the finger being measured. So I tried out a EKG Sensor which displayed a higher resolution of the heartbeat on processing. There are 3 electrodes patches placed on the skin: One on the right wrist for the reference, one on right elbow for the negative alligator clip and one on the left elbow for the positive clip. The EKG Sensor is connected with the Arduino to Ground, 5V and Analog Input A0. The heartbeat is displayed with Processing. | The selfmade sensor with the IR Emitter and Detector is very sensitive for any motion and movements of the finger being measured. So I tried out a EKG Sensor which displayed a higher resolution of the heartbeat on processing. There are 3 electrodes patches placed on the skin: One on the right wrist for the reference, one on right elbow for the negative alligator clip and one on the left elbow for the positive clip. The EKG Sensor is connected with the Arduino to Ground, 5V and Analog Input A0. The heartbeat is displayed with Processing. | ||
<gallery> | <gallery> | ||
File: | File:IMG 0828.JPG|EKG Sensor | ||
File: | File:IMG 0830.JPG|EKG Sensor with Arduino board | ||
File: | File:IMG 0831.JPG|electrode patches with alligator clips | ||
File: | File:IMG 0835.JPG|three electrode patches placed on arms | ||
File: | File:IMG 0837.JPG|positive electrode on left elbow | ||
File: | File:IMG 0838.JPG|negative reference electrode on right arm | ||
File: | File:ekg sensor.jpg|heartbeat on processing window | ||
File: | File:ekg sensor calm.jpg|heartbeat calm | ||
File: | File:ekg sensor increased.jpg|heartbeat increased | ||
File: | File:ekg sensor processing screen.jpg|heartbeat on processing window | ||
</gallery> | </gallery> | ||
[[/Codes for Arduino and Processing - EKG Sensor/]] | |||
This was a pretty good thing to test but unfortunately it wasn't convenient for a design to wear it every day and take everywhere I go. In cause of that and diverse failed trys to make a sensor by my own, I decided to buy a device. | This was a pretty good thing to test but unfortunately it wasn't convenient for a design to wear it every day and take everywhere I go. In cause of that and diverse failed trys to make a sensor by my own, I decided to buy a device. | ||
===Realization=== | ===Realization=== | ||
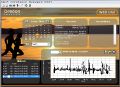
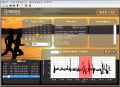
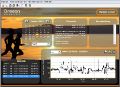
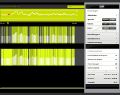
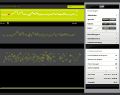
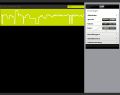
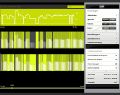
This device is a Data-Logger which goes with a chest strap: the chest strap measures the heartrate and the Data-Logger saves it every 2nd or each second. The saved values are collected in CSV-files which can be displayed with the program of the Data-Logger, shown with the images below. | |||
<gallery> | <gallery> | ||
File:brustgurt.jpg| chest strap | File:brustgurt.jpg| chest strap | ||
File: | File:IMG 0853.JPG|chest strap and data-logger | ||
File: | File:IMG 0855.JPG|data-logger | ||
File: | File:IMG 0856.JPG|data-logger | ||
File:oregon-data- | File:oregon-data-logger 2.jpg|interface data-logger program | ||
File:oregon-data- | File:oregon-data-logger 2 markiert.jpg|interface data-logger program | ||
File:oregon-data- | File:oregon-data-logger 3.jpg|interface data-logger program | ||
</gallery> | </gallery> | ||
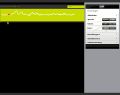
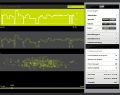
The program of the Data-Logger to visualize the collected data is a pretty good way to have a quick view to the results of the measurements. But the CSV-files need to be cleaned of extreme and zero values which were saved in cause of disturbances between the connection of the chest strap and the Data-Logger. The following images below show possible interface designs to display the collected heart rate and to analyse the results. | The program of the Data-Logger to visualize the collected data is a pretty good way to have a quick view to the results of the measurements. But the CSV-files need to be cleaned of extreme and zero values which were saved in cause of disturbances between the connection of the chest strap and the Data-Logger. The following images below show possible interface designs to display the collected heart rate and to analyse the results. | ||
< | |||
====Ways For Visualization==== | |||
<gallery> | |||
File:diagram heartrate 1.jpg|possible interface design | |||
File:diagram heartrate 2.jpg|possible interface design | |||
File:diagram heartrate 3.jpg|possible interface design | |||
File:diagram heartrate 4.jpg|possible interface design | |||
File:diagram heartrate 5.jpg|possible interface design | |||
File:diagram heartrate 6.jpg|possible interface design | |||
File:diagram heartrate 7.jpg|possible interface design | |||
</gallery> | |||
<videoflash>GHffvZN_waE|300|200</videoflash> | |||
[[/Codes for Processing/]] | |||
====Alternatives For Visualization==== | |||
<gallery> | <gallery> | ||
File:maps- | File:maps-neuronen.jpg | ||
File: | File:maps-heartrate.jpg | ||
File:farbverlauf-bubbles.jpg | |||
File:kreis frequenz.jpg | |||
File: | |||
File: | |||
</gallery> | </gallery> | ||
The project and the two devices were a pretty good way for getting started with the idea of heartbeat, collecting emotional data. But there are still some Things which need to be improved: | The project and the two devices were a pretty good way for getting started with the idea of heartbeat, collecting emotional data. But there are still some Things which need to be improved: | ||
As I mentioned the disturbances between the two devices I had to check the Connection between the two devices permanently because in some cases the signal wasn't strong enough and got interrupted through electro magnetic fields. Furthermore ist was very unconvinient and not very comfortable to wear the chest strap the whole time. I wore it every day for two weeks and was pretty stressed out. It may be ok to wear it while doing sports for that short period of time but not in everyday life. Possible could be to make an earclip or to integrate it into a device or a thing you need every day. | As I mentioned the disturbances between the two devices I had to check the Connection between the two devices permanently because in some cases the signal wasn't strong enough and got interrupted through electro magnetic fields. Furthermore ist was very unconvinient and not very comfortable to wear the chest strap the whole time. I wore it every day for two weeks and was pretty stressed out. It may be ok to wear it while doing sports for that short period of time but not in everyday life. Possible could be to make an earclip or to integrate it into a device or a thing you need every day. | ||
Latest revision as of 00:46, 12 April 2012
EHP - Emotion Heartbeat Project
The "Emotion Heartbeat Project" is a project that will collect my heartrate as a datatype. This data will be displayed in a visual way with diagrams and create an emotional diary out of that. With an increased heartrate the heartrate monitor will ask for the cause of it to differentiate between positive and negative stress or sports activities.
First Ideas And Thoughts

EHP

Emotion Diary
Headphones
Heartrate Monitor
Decision Diagram
Manual Measurement
Collected Heartbeat-Data Within 1 Week
Heartrate Diagrams


One of my first ideas was to connect the heartrate monitor with headphones that would calm down my increased heartrate with music and vibrating sensors at my neck; showing picture 3 and 5. The decision diagram displays how this should work. But within this semester I will just build up the heartrate monitor itself.
Picture 6 and 7 are showing the result of 1 week of collecting heartrate data. I counted my heartbeat within 1 minute manually 4 times a day for 1 week. Pic 6 shows a diagram displaying the whole week at a glance; Pic 7 shows the diagrams of each day in particular. (Unfortunately I couldn't get it work with a consistent scale for the heartrate.)
Related Links To That Topic
- http://www.eng.utah.edu/~jnguyen/ecg/instructions.html
- http://www.swharden.com/blog/2009-08-14-diy-ecg-machine-on-the-cheap/
- http://infosthetics.com/archives/2006/07/beating_heart_blog.html
- http://netzspannung.org/cat/servlet/CatServlet/$files/320590/herzfassen-technik.pdf
How To Build It?
HEARTRATE SENSOR, SIMPLE CIRCUIT
circuit 1
circuit 2
circuit 3
circuit 4
IR-Emitter/Detector
circuit schematic
arduino processing

processing screen


Inspired by diverse links and Youtube videos the very first try to build it was to use IR Emitter and Detector. It didn't work that well: the sensors are pretty sensitive for moving action and the signal at processing was very faint.
So I decided to try it again with an amplifier to get a stronger signal of my heartbeat.
To amplify the signal I used a low voltage op-amp LM358N.
The images of the third gallery show the circuit, schematic and processing screen result.
The Data Logger Shield for the Arduino board is directly plugged on the top of it and will save the collected data to a SD card.
HEARTRATE SENSOR WITH AMPLIFIER
circuit with amplifier
circuit with amplifier
circuit schematic

processing screenshot
Arduino with Data Logger Shield
Arduino with Data Logger Shield


Codes for Arduino and Processing
Related Links
- http://www.youtube.com/watch?v=BAp1snPchT4&NR=1
- http://www.youtube.com/watch?v=yADsi5W-Lls
- http://www.andere-baustelle.net/?page id=101
- http://suchamagicworld.blogspot.com/2008/04/still-alive-heartbeat-irsensor-report.html
THE EKG SENSOR
The selfmade sensor with the IR Emitter and Detector is very sensitive for any motion and movements of the finger being measured. So I tried out a EKG Sensor which displayed a higher resolution of the heartbeat on processing. There are 3 electrodes patches placed on the skin: One on the right wrist for the reference, one on right elbow for the negative alligator clip and one on the left elbow for the positive clip. The EKG Sensor is connected with the Arduino to Ground, 5V and Analog Input A0. The heartbeat is displayed with Processing.
EKG Sensor
EKG Sensor with Arduino board
electrode patches with alligator clips
three electrode patches placed on arms
positive electrode on left elbow
negative reference electrode on right arm
heartbeat on processing window
heartbeat calm
heartbeat increased
heartbeat on processing window


Codes for Arduino and Processing - EKG Sensor
This was a pretty good thing to test but unfortunately it wasn't convenient for a design to wear it every day and take everywhere I go. In cause of that and diverse failed trys to make a sensor by my own, I decided to buy a device.
Realization
This device is a Data-Logger which goes with a chest strap: the chest strap measures the heartrate and the Data-Logger saves it every 2nd or each second. The saved values are collected in CSV-files which can be displayed with the program of the Data-Logger, shown with the images below.
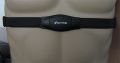
chest strap
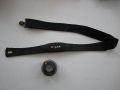
chest strap and data-logger
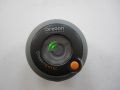
data-logger
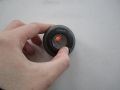
data-logger
interface data-logger program
interface data-logger program
interface data-logger program


The program of the Data-Logger to visualize the collected data is a pretty good way to have a quick view to the results of the measurements. But the CSV-files need to be cleaned of extreme and zero values which were saved in cause of disturbances between the connection of the chest strap and the Data-Logger. The following images below show possible interface designs to display the collected heart rate and to analyse the results.
Ways For Visualization

possible interface design
possible interface design
possible interface design
possible interface design
possible interface design
possible interface design
possible interface design


<videoflash>GHffvZN_waE|300|200</videoflash>
Alternatives For Visualization


The project and the two devices were a pretty good way for getting started with the idea of heartbeat, collecting emotional data. But there are still some Things which need to be improved: As I mentioned the disturbances between the two devices I had to check the Connection between the two devices permanently because in some cases the signal wasn't strong enough and got interrupted through electro magnetic fields. Furthermore ist was very unconvinient and not very comfortable to wear the chest strap the whole time. I wore it every day for two weeks and was pretty stressed out. It may be ok to wear it while doing sports for that short period of time but not in everyday life. Possible could be to make an earclip or to integrate it into a device or a thing you need every day.