(Created page with "<div style="float:right;border-left: solid 7px #ffffff;">200px</div> I want to play around with my tracking data (GPS and GPX) coming from my runni...") |
No edit summary |
||
| Line 1: | Line 1: | ||
I want to play around with my tracking data (GPS and GPX) coming from my running app <i>Runmeter</i> (fig. 1). My initial idea is to visualize the tracks I run in the park nearby. By layering my tracks I try to create neat shapes and patterns with the help of processing… I'm still in the trying. | I want to play around with my tracking data (GPS and GPX) coming from my running app <i>Runmeter</i> (fig. 1). My initial idea is to visualize the tracks I run in the park nearby. By layering my tracks I try to create neat shapes and patterns with the help of processing… I'm still in the trying. | ||
<br clear="all"> | <br clear="all"> | ||
| Line 6: | Line 4: | ||
== #1 Approach == | == #1 Approach == | ||
<gallery widths=" | <gallery widths="200px" heights="300px" perrow="4"> | ||
File:Eavthin_stats.PNG| My running tracks | File:Evathin_runmeter.png| My running app: Runmeter | ||
File:Evathin_tracks.PNG| | File:Eavthin_stats.PNG| My running tracks | ||
File:Evathin_diagramme.PNG| | File:Evathin_tracks.PNG| My track in the app | ||
File:Evathin_diagramme.PNG| The output visualized | |||
</gallery> | </gallery> | ||
== #2 Approach == | |||
<div style="float:left;border-left: solid 7px #ffffff;">[[File:Evathin_runroute.gif|240px]]</div> | |||
When playing the sketch, I’d like to see the tracks I’ve running with the follwing effects:<br> | |||
1) When pushing <i>enter</i> I’d like to let my track start running after it popped up.<br> | |||
The track I ran should be in a specific colour.<br> | |||
2) One effect I would like to achive is to manipulate the speed of my route.<br> | |||
I would like the sketch to automatically add an intense colour to the stroke of the GPX trace according to the speed I ran. Also, viceversa: The route faints when the speed slows down.<br> | |||
3) Another route I ran should be added, when pushing enter another time. It should alter its appearance the same way as the other routes that are on the canvas. | |||
<br clear="all"> | <br clear="all"> | ||
Revision as of 20:25, 26 August 2014
I want to play around with my tracking data (GPS and GPX) coming from my running app Runmeter (fig. 1). My initial idea is to visualize the tracks I run in the park nearby. By layering my tracks I try to create neat shapes and patterns with the help of processing… I'm still in the trying.
#1 Approach
My running app: Runmeter
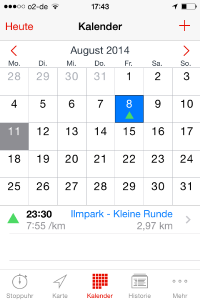
My running tracks
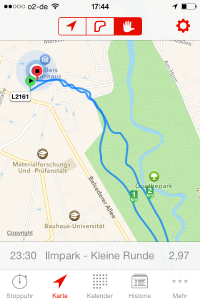
My track in the app
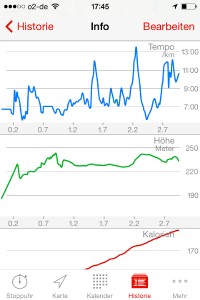
The output visualized


#2 Approach
When playing the sketch, I’d like to see the tracks I’ve running with the follwing effects:
1) When pushing enter I’d like to let my track start running after it popped up.
The track I ran should be in a specific colour.
2) One effect I would like to achive is to manipulate the speed of my route.
I would like the sketch to automatically add an intense colour to the stroke of the GPX trace according to the speed I ran. Also, viceversa: The route faints when the speed slows down.
3) Another route I ran should be added, when pushing enter another time. It should alter its appearance the same way as the other routes that are on the canvas.