(Created page with "<div style="float:right;border-left: solid 7px #ffffff;">200px</div> I want to play around with my tracking data (GPS and GPX) coming from my runni...") |
|||
| (13 intermediate revisions by the same user not shown) | |||
| Line 1: | Line 1: | ||
With processing, I'd like to play around with my tracking data (GPS and GPX) coming from my running app <i>Runmeter</i>. My initial idea is to visualize the tracks I run. By layering my tracks on top of each another, I try to create patterns and shapes that work in a certain algorithm. | |||
I | |||
<br clear="all"> | <br clear="all"> | ||
== #1 Approach == | == #1 Approach == | ||
<gallery widths= | <gallery widths=226px" heights="340px" perrow="3"> | ||
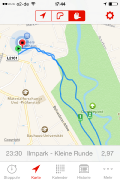
File:Eavthin_stats.PNG| My running tracks | File:Evathin_runmeter.png| My running app: Runmeter | ||
File:Evathin_tracks.PNG| | File:Eavthin_stats.PNG| My running tracks | ||
File: | File:Evathin_tracks.PNG| My track in the app | ||
</gallery> | |||
== #2 Approach == | |||
<div style="float:left;border-left: solid 7px #ffffff;">[[File:Evathin_runroute.gif|240px]]</div> | |||
When playing the sketch in processing, I’d like to see the tracks I’ve ran with the follwing effects: | |||
# My tracks pop up after pushing <i>enter</i>.Then they start running. | |||
# The tracks are coloured. | |||
# The speed of my tracks automatically add an intense colour to the stroke of the GPX trace according to the speed I ran. Viceversa: The route faints when the speed slows down. | |||
# Another track I ran will be added after pushing <i>enter</i> another time. | |||
<gallery widths=226px" heights="340px" perrow="2"> | |||
File:Evathin_gpx_running.png| This is where I got lost… | |||
File:Evathin_gpx_code.png|the code | |||
</gallery> | </gallery> | ||
I used Processing 2.2.1. | |||
<br clear="all"> | <br clear="all"> | ||
== #3 Approach == | |||
<div style="float:left;border-left: solid 7px #ffffff;">[[File:Evathin_gestalt-code.png|340px]]</div> | |||
After the two approaches, I focused on a more graphic code. | |||
When moving the mouse the ellipse's speed changes. | |||
Latest revision as of 16:50, 14 October 2014
With processing, I'd like to play around with my tracking data (GPS and GPX) coming from my running app Runmeter. My initial idea is to visualize the tracks I run. By layering my tracks on top of each another, I try to create patterns and shapes that work in a certain algorithm.
#1 Approach

My running app: Runmeter

My running tracks
My track in the app


#2 Approach
Error creating thumbnail: convert convert: Unrecognized option (-layers). Error code: 1
When playing the sketch in processing, I’d like to see the tracks I’ve ran with the follwing effects:
- My tracks pop up after pushing enter.Then they start running.
- The tracks are coloured.
- The speed of my tracks automatically add an intense colour to the stroke of the GPX trace according to the speed I ran. Viceversa: The route faints when the speed slows down.
- Another track I ran will be added after pushing enter another time.
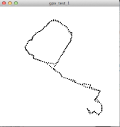
This is where I got lost…
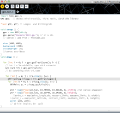
the code


I used Processing 2.2.1.
#3 Approach

After the two approaches, I focused on a more graphic code. When moving the mouse the ellipse's speed changes.