Glozt100sob (talk | contribs) |
Glozt100sob (talk | contribs) |
||
| Line 15: | Line 15: | ||
'''Project Objective''' | '''Project Objective''' | ||
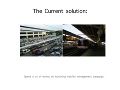
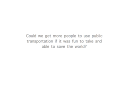
I introduce an iOS application namely Relieve Climate ,which supports | I introduce an iOS application namely Relieve Climate ,which supports Mobility Management (MM). Mobility Management measures is a pull, a new concept in a developed country is expected to effectively manage the growing amount of private car. The main idea is to give knowledge or publicity information related to travel through the cooperation between various departments. Along with the use of tools or measures to encourage motorists to change their attitudes and behavior on the trip (Voluntary Behavior Change). Relieve Climate responds to impulse daily car users to get involved to public transportation focusing on Bangkok Transit System (BTS) skytrain located in Bangkok Thailand. The application continuously keeps tracking user's trip data presenting in a quantity of saved Carbon Dioxide. After that, visualizes the data to become semi-tangible graphic on the device’s interface. Furthermore, marketing technique is a key implemented to this Mobility Management. As a result , the applicants who cumulatively collect a bunch of Carbon Dioxide data would be rewarded with a prize from official sponsors collaborating with BTS skytrain. The expect result of the application is demanding less car use and convinced to take a public transport. | ||
==Demonstration Phase and Target Audience== | ==Demonstration Phase and Target Audience== | ||
Revision as of 16:08, 15 March 2012
Relieve Climate Synopsis
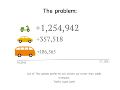
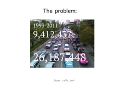
Problem
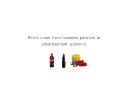
At the present day, people rely on personal comfort than responding to environment issue. As a result, using private vehicles:- cars, motorcycle not only making more air pollution than taking a train or railway system but also consuming more energy and fuel respectively. Furthermore, traffic jam problem in a metropolis is accordingly caused by high increase rate of personal vehicles. Beside, main emission from vehicles' engine fuel ignition are Carbon Dioxide gas which able to severely damage human respiratory system. Last but not least, exhaust gases aka. Green House gases:- Carbon Dioxide and Carbon Monoxide are the majority cause of climate change and global warming.
See how is nowadays Global Warming situation via the video below:
<videoflash type=vimeo>32591989|518|245</videoflash>
An Inconvenient Truth: Albert Arnold "Al" Gore, Jr.
video credit: http://vimeo.com/buck
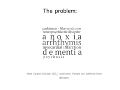
Project Objective
I introduce an iOS application namely Relieve Climate ,which supports Mobility Management (MM). Mobility Management measures is a pull, a new concept in a developed country is expected to effectively manage the growing amount of private car. The main idea is to give knowledge or publicity information related to travel through the cooperation between various departments. Along with the use of tools or measures to encourage motorists to change their attitudes and behavior on the trip (Voluntary Behavior Change). Relieve Climate responds to impulse daily car users to get involved to public transportation focusing on Bangkok Transit System (BTS) skytrain located in Bangkok Thailand. The application continuously keeps tracking user's trip data presenting in a quantity of saved Carbon Dioxide. After that, visualizes the data to become semi-tangible graphic on the device’s interface. Furthermore, marketing technique is a key implemented to this Mobility Management. As a result , the applicants who cumulatively collect a bunch of Carbon Dioxide data would be rewarded with a prize from official sponsors collaborating with BTS skytrain. The expect result of the application is demanding less car use and convinced to take a public transport.
Demonstration Phase and Target Audience
- For the alpha (prototype phase), the application focuses integrating in public sky train in Bangkok , Thailand namely BTS(Bankok Mass Transit System) Sky Train.
- The application focuses on iOS smart device holders, soon, on Android OS and etc.
- The target application users mainly are people who rarely take BTS Sky Train. However, daily or repetitive passengers are also in target group.
Why iOS device at prototype phase ?
here is the interesting stat which make a decision to launch alpha version in iOS devices instead of other smart phone operation system.

With the release of its quarterly earnings earlier today, Apple revealed that it had sold 37.04M iPhones in fiscal Q1 of 2012. Those numbers are massive, far bigger than any other manufacturer and beyond industry estimates.
Following the announcement, there was an interesting statistic shared on Twitter by designer and author of Mobile First, Luke Wroblewski:
"There are more iPhones sold per day (402k) than people born in the World per day (300k). twitter.com/#!/asymco/stat…"
The 37.04M iPhone figure divided out over the period of 98 days in the quarter gives us a slightly lower number at 377.9K sold every day, but it’s still higher than the world’s average birth rate which clocks in at 371K per day.
In conclusion, the more users own iOS devices, the more potential distribution could be. referred: http://thenextweb.com/
Relieve Climate Features and USPs
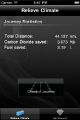
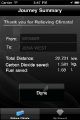
- Real-time Portable Data Tracker: Relieve Climate is an application which installed in mobile device and able to immediately synthesize the visualization once finishing tracking the data. To view user own data, no need to connect to personal computer or laptop.
- Ease to use: According to Human Interface Guide (HIG) which is a document that Apple distributes for guidance in developing iPhone Apps for sale on the App Store. Relieve Climate perfectly follow rules and restrictions in HIG, as a result, the application is easy to use and no instruction is required.
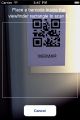
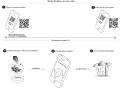
- QR-Code Reader embedded: Relieve Climate uses Zxing(pronounced zebra crossing) QR-Code scanner library which provides powerful scanner function via mobile camera. Quick and easy scanning are applicable perfectly to application.
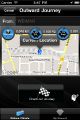
- GPS and Mapkit embedded: To view current position while checking-in, Mapkit used for previewing a position on Google map. Furthermore, GPS device can also inform exact position of user.
- Brain Train Tip Feature: The application provides brain improvement while user get involved to application. For example, while users is activating journey, they are able to read hints of idea which provide a little knowledge according to general subject in our life such as health, sciences, history, life style and etc.
Relieve Climate Screenshots

Relieve Climate#1

Relieve Climate#2
Relieve Climate#3
Relieve Climate#4
Relieve Climate#5

Relieve Climate#6
Relieve Climate#7

Relieve Climate#8


Project Conclusion Presentation
WinMe Project Synopsis#1
WinMe Project Synopsis#2
WinMe Project Synopsis#3
WinMe Project Synopsis#4
WinMe Project Synopsis#5
WinMe Project Synopsis#6
WinMe Project Synopsis#7
WinMe Project Synopsis#8
WinMe Project Synopsis#9


Project References
Project Inquiries:
The German railway company Deutsche Bahn has released a beautiful educational video that explains the benefits of an environmentally conscious behaviour. In particular, the video suggests that travelling by train produces less CO2 than travelling by car or by plane.
<videoflash type=vimeo>30990475|437|236</videoflash> link to video source: here
Zxing for iOS, qr code decoder library.
<videoflash>H8WjmDBHgw4</videoflash>
Referred document resources::
Bangkok Transit System (BTS) Fact sheets
Emissions of carbon dioxide per capital
Automotive Statistics
- I.Cars produced in the world.
- II.Vehicle sales stats in Thailand.
- III.Vehicle sales table in 1993-2011.
- IV.Bangkok Metropolitan Region
Zxing (Zebra-Crossing) site reference
Data Collecting Experiment
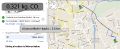
This section I would like to describe about my first experiment with data collecting. During Monday 14.11 to Sunday 20.11, I collected the data from roughly measurement distances between the places I had been in each day. After that, I jot down how far distances I travelled then calculated into amount of Carbon Dioxide, which I was able to save. Please look at the illustrators below:
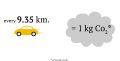
approximately Co2 released rate
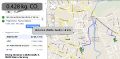
Data Collected on Monday 14.11 and Tuesday 15.11
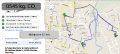
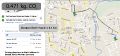
Data Collected on Wednesday 16.11
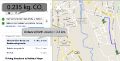
Data Collected on Thursday 17.11
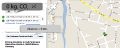
Data Collected on Friday 18.11
Data Collected on Saturday 19.11
Data Collected on Sunday 20.11


When the datas were adequately collected. The datacollect.tsv was set up as in row and column as below:

I made a sketch which visualize the datas, which i collected. The sketch represented in bubble animation form using sin() function and each circles' color represents the day when I collected the informations. In addition, maximum size of growing circle informs how much Co2 rate, I could save. Lastly, the circles are randomly located by random() function with array[]. See my several visualized datas as pictures below:


dataCollectingCo2 sketch example code
/* data visualization :: How much I can save Co2 releasing in 1 week.
 *
 * an experiment from collecting the data then visualize these datas to motion graphic.
 *
 *
 * Patawat Phamuad 2011
 */

Table dataTable;
int numCircles=7;
int rowCount;
float rad = 20f;
float angle = 0.0f;
float speed = 0.01;

float[] xPositions = new float[numCircles];
float[] yPositions = new float[numCircles];

void setup() {
  size(300, 300);
  noStroke();
  smooth();

  dataTable = new Table("datacollect.tsv");
  rowCount = dataTable.getRowCount();

  for (int i=0; i< numCircles; i++) {
    xPositions[i] = random(0, width);
    yPositions[i] = random(0, height);
  }
}

void draw() {
  background(0);
  angle += speed;
  float diameter = sin(angle)*300;
  for (int row=0;row<rowCount;row++) {

    String date = dataTable.getString(row, 0);
    float distance = dataTable.getFloat(row, 1);
    float co2 = dataTable.getFloat(row, 2);

    if (row==0) {
      fill(255, 255, 0, 155);
      ellipse(xPositions[row], yPositions[row], diameter*co2, diameter*co2);
    }
    else if (row==1) {
      fill(234, 114, 234, 155);
      ellipse(xPositions[row], yPositions[row], diameter*co2, diameter*co2);
    }
    else if (row==2) {
      fill(42, 165, 27, 155);
      ellipse(xPositions[row], yPositions[row], diameter*co2, diameter*co2);
    }
    else if (row==3) {
      fill(232, 84, 26, 155);
      ellipse(xPositions[row], yPositions[row], diameter*co2, diameter*co2);
    }
    else if (row==4) {
      fill(15, 8, 255, 155);
      ellipse(xPositions[row], yPositions[row], diameter*co2, diameter*co2);
    }
    else if (row==5) {
      fill(121, 13, 180, 155);
      ellipse(xPositions[row], yPositions[row], diameter*co2, diameter*co2);
    }
    else if (row==6) {
      fill(255, 0, 0, 155);
      ellipse(xPositions[row], yPositions[row], diameter*co2, diameter*co2);
    }
    println("Date:" +date+ " Total distance:" +distance+" km."+ " Co2 Safe:"+co2 +" kg.");
  }

  println("========");
  println(rowCount);
}
to download example sketches click link below: Media:dataCollectingCo2.zip