Fingies Landing Page
We were provided with the task to re-design the current landing page for the Fingies Project.
The software being installed on PC include Sublime Text (code editor), Xampp (PHP and Apache servers).
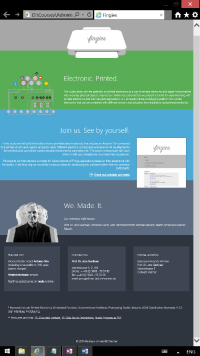
We were first asked to design the layout of the front-end.
The front-end layout I designed.
After that, we were introduced to, and played around with, the current WYSIWYG solutions of Content Management System (CMS), including Tinymce, NicEdit, etc.
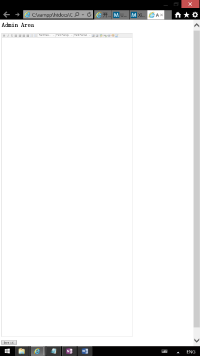
We then built up our own CMS using HTML, JavaScript and PHP to build the back-end from sketch. We borrowed the rich-text editor directly from existing CMS. I don’t have a solid background of programming, but along the way our instructor has taught the syntax of PHP while building the CMS.
The back-end of mine.
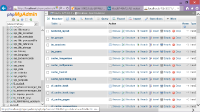
We then dug further into the feature sets a mature CMS should be equipped, with reference to popular CMS solutions like Joomla and Magento. After that, we decided to give the popular German-made CMS (other than Wordpress), Typo3, a try. With it, the single-page landing page developed into a multi-page site. We learnt a bit about TypoScript, the language specific to Typo3.
Using Typo3.
Data visualization
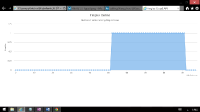
After the CMS section, we moved on to work with data visualization, because afterwards we would try to implement the Fingies API and visualize (and work with) live data received from different Fingies boxes. We’ve spent time studying the APIs provided by the online visualizing library, Highcharts.com. In the meantime, we were given the Fingies API to derive the online Fingies count of the current moment. Our assignment, hence, is to visualize the online Fingies count in a Highchart diagram.
Highchart diagram of online Fingies count.
But this was not where we stopped with visualization. We then moved on to SVG, the vector graphics based on XML. To edit SVG image further, I have installed Inkscape, alternative to Illustrator, on my PC.
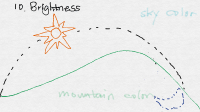
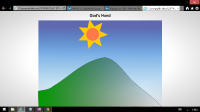
We were then required to make our own visualization project utilizing the multiple sensors of a Fingies box, or devices that connect to the Fingies server. I played around with the gyroscope of my Windows Tablet, and created a web app called the God’s Hand.
The idea is simple: There I build a microcosm in the computer, with sky, mountain, the sun and the moon. With your hand repositioning the tablet, the timing in the microcosm will change, and you will be able to see the sun going down and moon up, and vice versa.
Prototype of God’s Hand.
Realization of God’s Hand.
Finally, when we have finished the above agenda for this semester’s Administrating Data class, we were asked to fine tune our mobile phone to remotely control the Showreel SS14 web app developed for the showcase of this event. The mechanism being adopted behind here is the Hammer.js, a touch-based JavaScript library available in the wild.
