Project
The aim of project is to create the visualization which controls by muscle tension by using Electromyography Sensor (EMG). At the beginning I used EMG sensor to get the output data but the sensor burnt while connecting to the electricity. Then I did some research and tried to make the muscle tension sensor by myself. However it works but does not precisely as the EMG sensor. The sensor will send data through Arduino and send to Max/MSP. In the end, the visualization shows the variation of shapes and their meshes according to the data from the sensor.

1st test with EMG Sensor:
EMG Sensor Circuit:


EMG Sensor with Arduino:
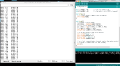
I connected EMG sensor with Arduino. The highest output value is 225 and the lowest is 72
Transfer value from Arduino to Max/msp


Creating simple muscle sensor and visualization:
Link to the Visualization video: https://vimeo.com/350960043
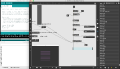
Completed patch:

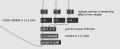
Making the muscle sensor: By following the instruction from the link below, I made the sensor by using diode (TS4148 RY), capacitor (47uF) and amplifier (INA128). Getting the output, I connected the sensor to Arduino and uploaded the code to get the output data. Although I could not get the output data precisely when I tensed my muscle, the output number changed when I pressed my muscle on black and red connectors. https://hackaday.io/project/8823-super-simple-muscle-emg-sensor


Creating the visualization: Firstly I created window and renderer to display the visualization by using jit.world and changed screen’s background colour. Seconly I created shape for rendering, in which I can control the shape and colour of it. Thirdly I created mesh of the shape to control draw mode and scale. Fourthly I created the rotation of the shape and connected to jit.gl.mesh to make the visualization move dynamically.
Visualization part
Rotation of the shape

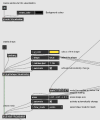
Connecting Arduino to Max/msp: After connecting the sensor to Arduino, I got the values between 20 to 883. Then I scaled down the range of number to 0 to 150 in Max/msp. After that I created the condition for the number to control the visualization, by using togedge to send the message to jit.gl.gridshape to change the form and jit.gl.mesh to change draw mode and scale. Lastly the rotation of the shape could also control by the values, by creating 3 float numbers and connected to jit.euler2quat, which would translate the number to x, y and z axis, and sent them to jit.gl.mesh.


Experimenting with Max Patches
This patch is the one that I followed general tutorial to get to know about Max/msp.
For this sound visualization patch, I took a look more into specific tutorial about what I am interested.
Connect EMG sensor (Arduino) with visualisation patch.