WinMe Ticket Project Synopsis
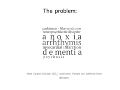
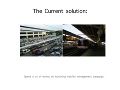
Mobility Management measures is a Pull, a new concept in a developed country is expected to effectively manage the growing amount of private car. The main idea is to give knowledge or publicity information related to travel through the cooperation between various departments. Along with the use of tools or measures to support or encourage motorists to change their attitudes and behavior on the trip (Voluntary Behavior Change).
WinMe Project Synopsis#1
WinMe Project Synopsis#2
WinMe Project Synopsis#3
WinMe Project Synopsis#4
WinMe Project Synopsis#5
WinMe Project Synopsis#6
WinMe Project Synopsis#7
WinMe Project Synopsis#8
WinMe Project Synopsis#9
- Winme 10.png
WinMe Project Synopsis#10


Project Inquiries:
The German railway company Deutsche Bahn has released a beautiful educational video that explains the benefits of an environmentally conscious behaviour. In particular, the video suggests that travelling by train produces less CO2 than travelling by car or by plane.
<videoflash type=vimeo>30990475|437|236</videoflash> link to video source: here
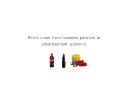
- NutriSmart prototype embeds 'RFID' tags directly within food.
<videoflash type=vimeo>24332950|437|236</videoflash>
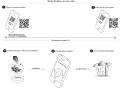
- QR Code reader on iOS device and AR interaction implement.
<videoflash type=vimeo>8468513|437|236</videoflash>
Referred resources::
Bangkok Transit System (BTS) Fact sheets
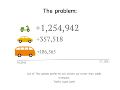
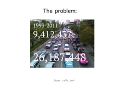
Emissions of carbon dioxide per capital
Automotive Statistics
Data Collecting Experiment
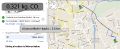
This section I would like to describe about my first experiment with data collecting. During Monday 14.11 to Sunday 20.11, I collected the data from roughly measurement distances between the places I had been in each day. After that, I jot down how far distances I travelled then calculated into amount of Carbon Dioxide, which I was able to save. Please look at the illustrators below:
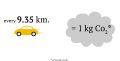
approximately Co2 released rate
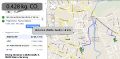
Data Collected on Monday 14.11 and Tuesday 15.11
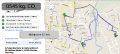
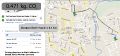
Data Collected on Wednesday 16.11
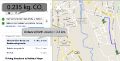
Data Collected on Thursday 17.11
Data Collected on Friday 18.11
Data Collected on Saturday 19.11
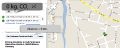
Data Collected on Sunday 20.11


When the datas were adequately collected. The datacollect.tsv was set up as in row and column as below:

I made a sketch which visualize the datas, which i collected. The sketch represented in bubble animation form using sin() function and each circles' color represents the day when I collected the informations. In addition, maximum size of growing circle informs how much Co2 rate, I could save. Lastly, the circles are randomly located by random() function with array[]. See my several visualized datas as pictures below:


dataCollectingCo2 sketch example code
/* data visualization :: How much I can save Co2 releasing in 1 week.
 *
 * an experiment from collecting the data then visualize these datas to motion graphic.
 *
 *
 * Patawat Phamuad 2011
 */

Table dataTable;
int numCircles=7;
int rowCount;
float rad = 20f;
float angle = 0.0f;
float speed = 0.01;

float[] xPositions = new float[numCircles];
float[] yPositions = new float[numCircles];

void setup() {
  size(300, 300);
  noStroke();
  smooth();

  dataTable = new Table("datacollect.tsv");
  rowCount = dataTable.getRowCount();

  for (int i=0; i< numCircles; i++) {
    xPositions[i] = random(0, width);
    yPositions[i] = random(0, height);
  }
}

void draw() {
  background(0);
  angle += speed;
  float diameter = sin(angle)*300;
  for (int row=0;row<rowCount;row++) {

    String date = dataTable.getString(row, 0);
    float distance = dataTable.getFloat(row, 1);
    float co2 = dataTable.getFloat(row, 2);

    if (row==0) {
      fill(255, 255, 0, 155);
      ellipse(xPositions[row], yPositions[row], diameter*co2, diameter*co2);
    }
    else if (row==1) {
      fill(234, 114, 234, 155);
      ellipse(xPositions[row], yPositions[row], diameter*co2, diameter*co2);
    }
    else if (row==2) {
      fill(42, 165, 27, 155);
      ellipse(xPositions[row], yPositions[row], diameter*co2, diameter*co2);
    }
    else if (row==3) {
      fill(232, 84, 26, 155);
      ellipse(xPositions[row], yPositions[row], diameter*co2, diameter*co2);
    }
    else if (row==4) {
      fill(15, 8, 255, 155);
      ellipse(xPositions[row], yPositions[row], diameter*co2, diameter*co2);
    }
    else if (row==5) {
      fill(121, 13, 180, 155);
      ellipse(xPositions[row], yPositions[row], diameter*co2, diameter*co2);
    }
    else if (row==6) {
      fill(255, 0, 0, 155);
      ellipse(xPositions[row], yPositions[row], diameter*co2, diameter*co2);
    }
    println("Date:" +date+ " Total distance:" +distance+" km."+ " Co2 Safe:"+co2 +" kg.");
  }

  println("========");
  println(rowCount);
}
to download example sketches click link below: Media:dataCollectingCo2.zip